Team Level Metrics

Published date: April 15, 2024, Version: 1.0

Delivery & Operations metrics at the team level (typically measure every Iteration).

CATEGORY - QUALITY 

Metrics Definition Comments RAGs Source Scope
Test Coverage

The extent to which test cases exercise the software under test.

Formula = (Number of Covered Requirements(stories) / Total Number of Requirements) * 100
  • Jira issue type = Story

  • Qtest tests are linked to stories

  • Stories assigned to an iteration & completed (status category = DONE) before iteration end date


    GREEN>90%.


    70% <= AMBER <= 90%


    RED < 70%

Jira + QTest

MVP
Test Case Effectiveness

The measure of how well the test cases can identify defects.

Formula = (Number of Defects Found / Number of Test Cases Executed) * 100
  • Jira issue type = Bug

  • Qtest tests are linked to bugs

  • Number of defects created within iteration time frame from Jira / number of tests executed within iteration time frame from QTest


GREEN>90%


70% <= AMBER <= 90%


RED < 70%

Jira + QTest MVP
% Unit Test Coverage

Percentage of a source code covered by unit tests

  • Standard sonar metric


GREEN > 80%


AMBER > 40%


RED <= 40%

Sonar MVP
Test Automation Coverage

The percentage of test cases that are automated out of the total test cases.

Formula = (Number of Automated Test Cases / Total Number of Test Cases) * 100
Number of automated tests in QTest / number of total tests in QTest at the end of each iteration OR over time


GREEN > 90%


70% <= AMBER <= 90%


RED < 70%

QTest MVP
Test Environment Availability

The availability and readiness of test environments for testing activities.

Formula = (Total Time Test Environment Available / Total Time Required for Testing) * 100
--------


GREEN > 99%


95% <= AMBER <= 99%


RED < 95%

TBD MVP+
First time to right (FTR) First Time Right shows a percentage of resolved issues without returns. The same as for Defect Reopen Rate, but for all issue types


GREEN < 10%


10% >= AMBER >= 20%


RED > 20%

Jira MVP+
Metric Definition Comments RAGs Example/Visualization Source Scope
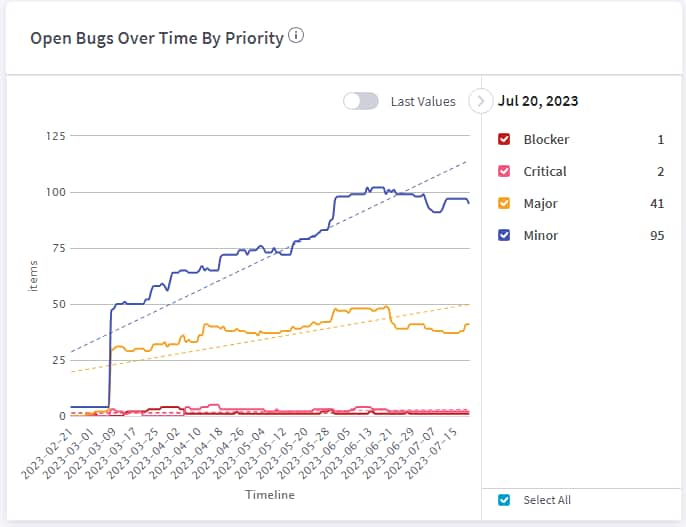
Defect Severity Distribution

The distribution of defects by priority level.

Formula = (Number of Defects by Priority Level / Total Number of Defects) * 100
  • Issue type = Bug

  • Distribution of priority field values for open (status category != DONE) defects over time - in actual numbers to see overall trend

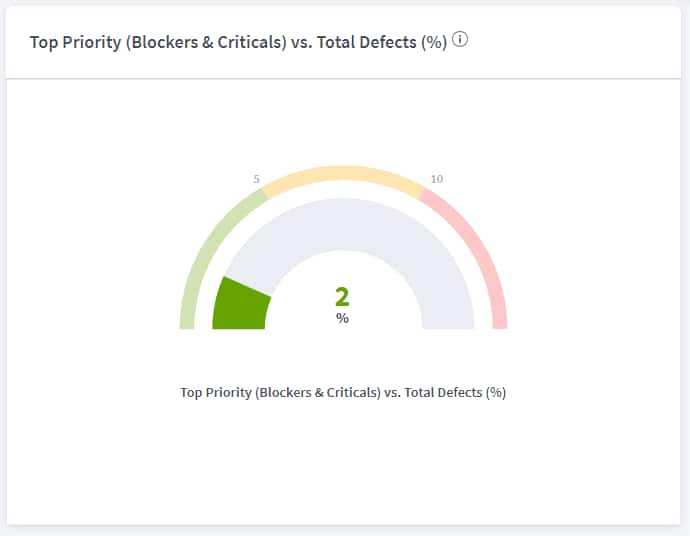
  • OR/AND % of created top-priority (Blocker, Critical) defects by iteration

% of created top-priority defects:

GREEN < 5%


10% >= AMBER


RED > 10%

Jira MVP
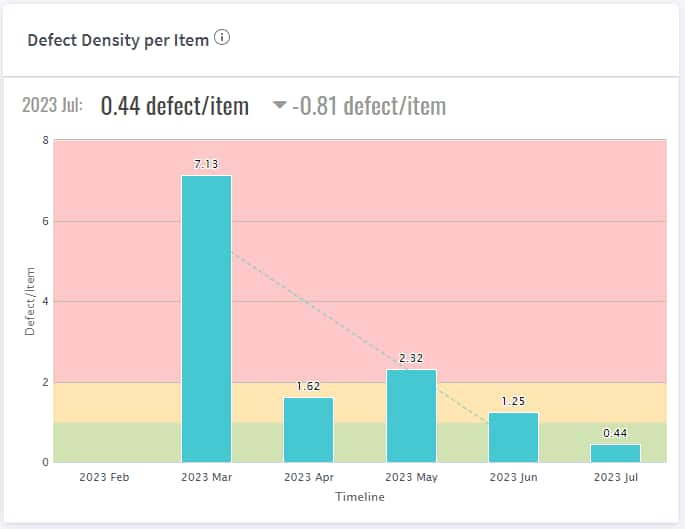
Defect Density

The number of defects identified in an iteration, divided by number of stories

Formula = Number of Defects / number of stories in an iteration
  • Issue types = Bug, Story

  • Number of bugs found within iteration timeframe / number of stories completed (status category = DONE) before iteration end date

GREEN < 1


1 >= AMBER >= 2


RED > 2

Jira MVP
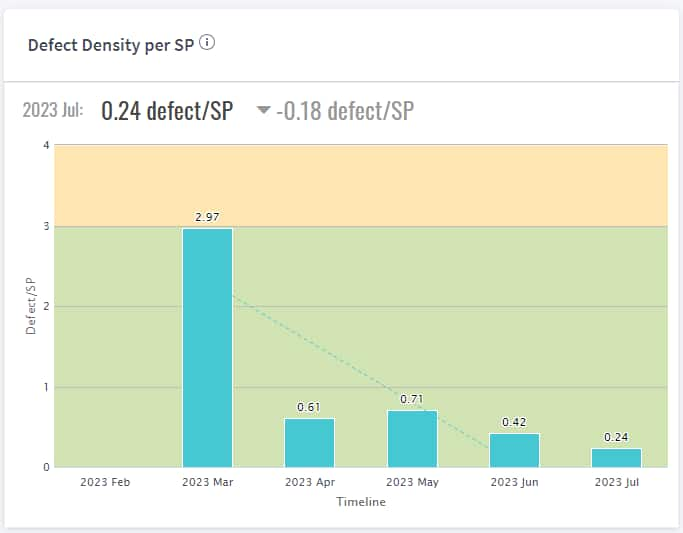
Defect Density

The number of defects identified in an iteration, divided by the size or complexity of the Iteration.

Formula = Number of Defects / Size or Complexity Metric (e.g. Story points)
  • Issue types = Bug, Story

  • Number of bugs found within iteration timeframe / number of story points completed (status category = DONE) before iteration end date

GREEN < 3


3 >= AMBER >= 5


RED > 5

Jira MVP+
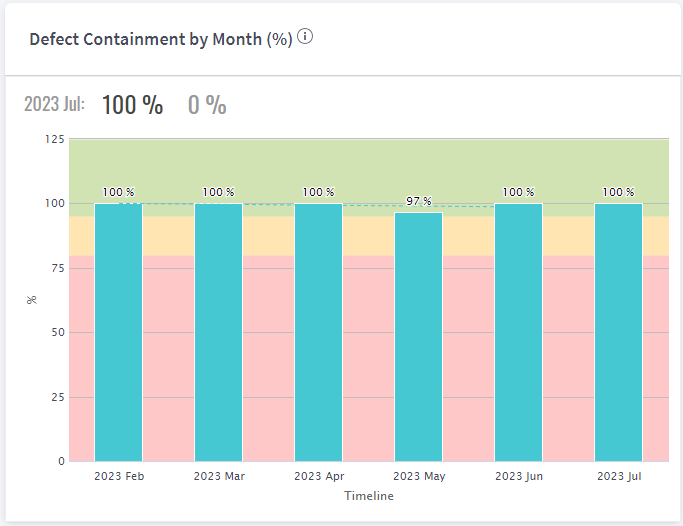
Escape Defect

Number of defects escaped to stage (E2E Testing)

Escape defect rate= number of defect found in stage/number of defects found in QA + Stage
Note: Does not include in iteration defects
  • Issue type = Bug

  • Environment = Stage, QA

  • Number of bugs created within iteration with environment = stage / Number of bugs created within iteration timeframe with environment = stage or QA

GREEN < 10%


10% >= AMBER


RED > 20%

Jira MVP
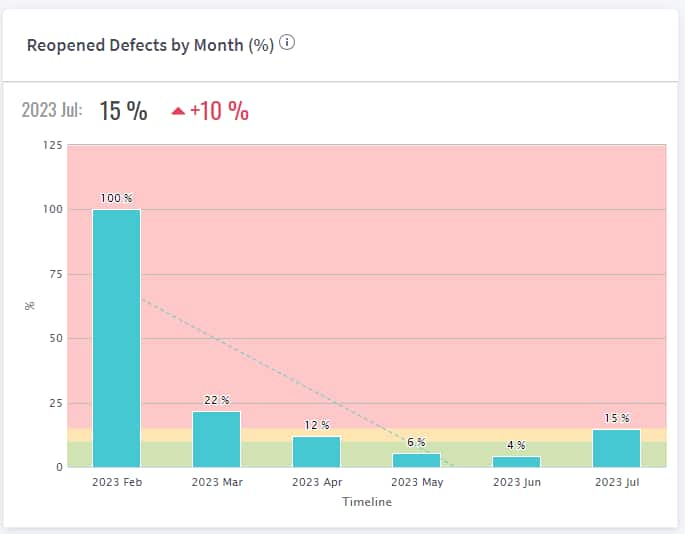
Defect Reopen Rate

The rate at which defects are reopened after being marked as resolved.

Formula = (Number of Reopened Defects / Total Number of Resolved Defects) * 100
  • Issue type = Bug

  • Status = Reopened

  • Number of bugs reopened (status=reopened) out of total number of completed bugs (status category = DONE) before iteration end date

GREEN < 10%


10% >= AMBER


RED > 20%

Jira MVP+

CATEGORY : PRODUCTIVITY

Metric


Definition


Comments


RAGs


Example/Visualization


Source


Scope
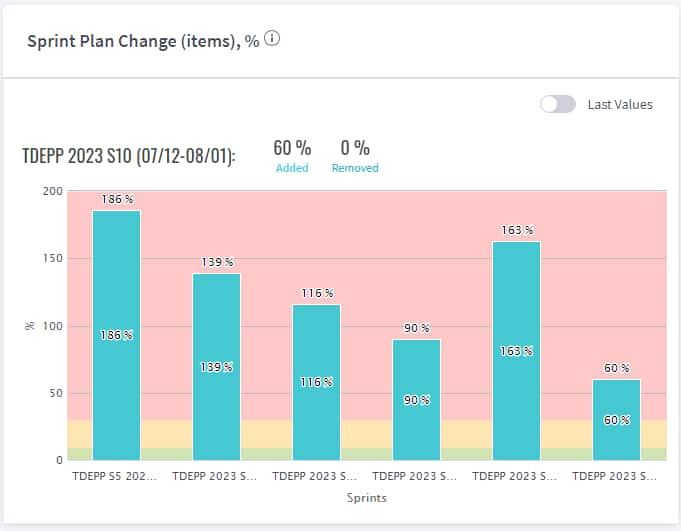
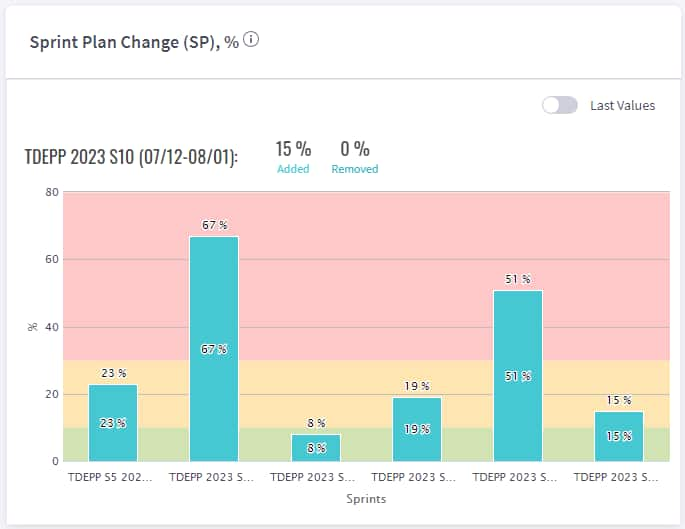
% Stories Added/Removed Percentage of stories added/removed from the Iteration after initial commitments.
  • Issue type = Story

  • Number of stories (story points) added/removed to iteration after iteration start date / Number of stories (story points) assigned to a iteration before iteration start date

GREEN < 10%


10% >= AMBER


RED > 30%

Jira MVP
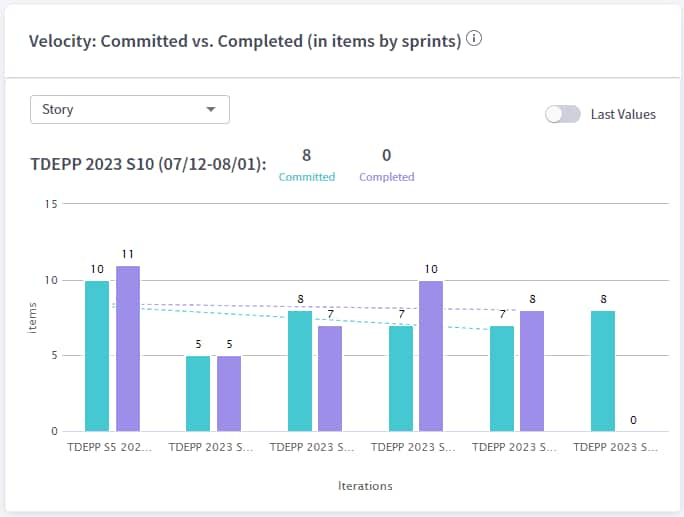
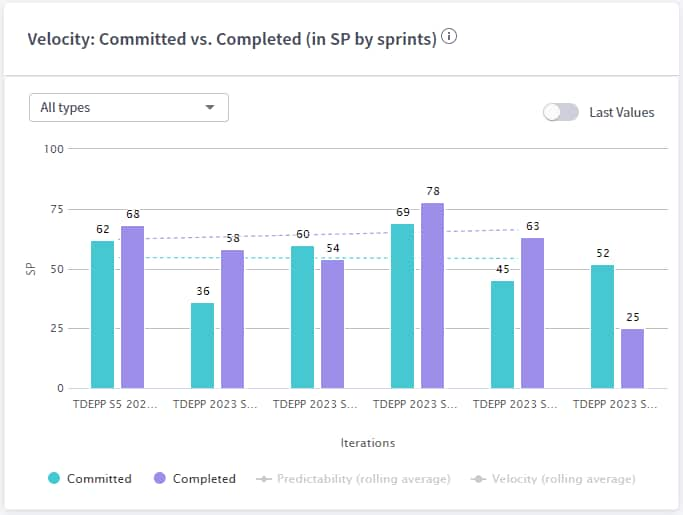
Team Velocity Number of story points completed in a Iteration
  • Number of story points completed (status category = DONE) before iteration end date

RAG can be set based on a constant value for a team (target velocity) or based on the velocity dynamics vs. previous iterations (velocity increased by 10% since last iteration)

Jira MVP
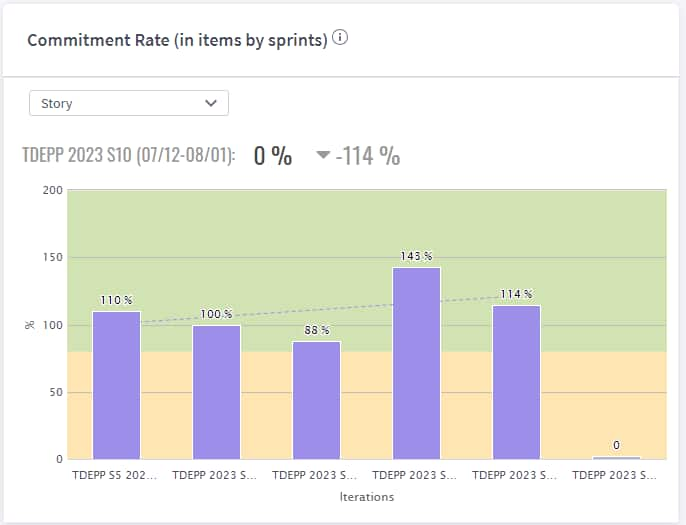
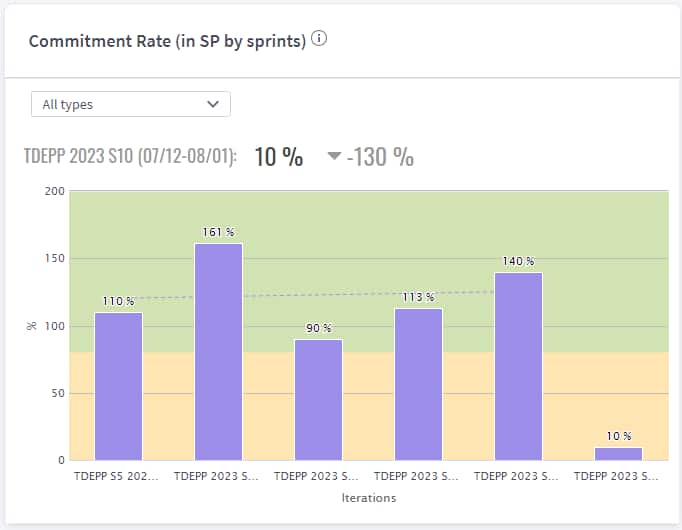
% Stories Completed Percentage of stories completed in a iteration
  • Issue type = Story

  • Number of stories (story points) completed (status category = DONE) before iteration end date / Number of stories (story points) assigned to a iteration before iteration start date

GREEN < 80%


 AMBER <= 80%


RED < 60%

Jira MVP
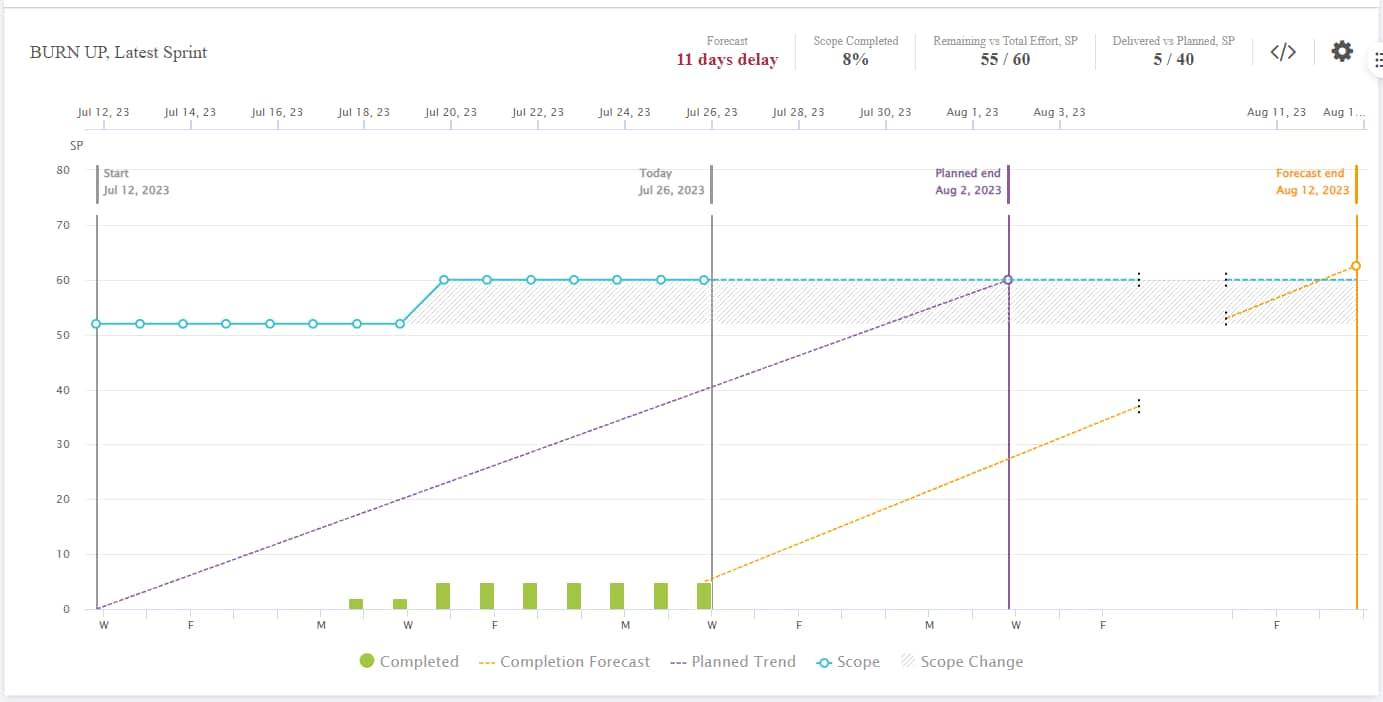
Iteration Burn Up/Down Charts Overall planned commitment (across multiple iterations) vs. actual delivery. Forecast on completion for iteration(s) scope (number of stories (story points) assigned to a iteration before iteration start date) based on current team’s velocity ---------------- jira MVP
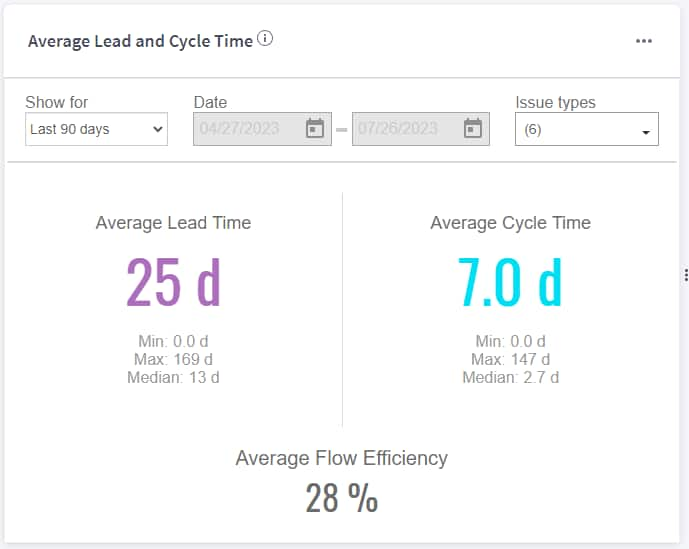
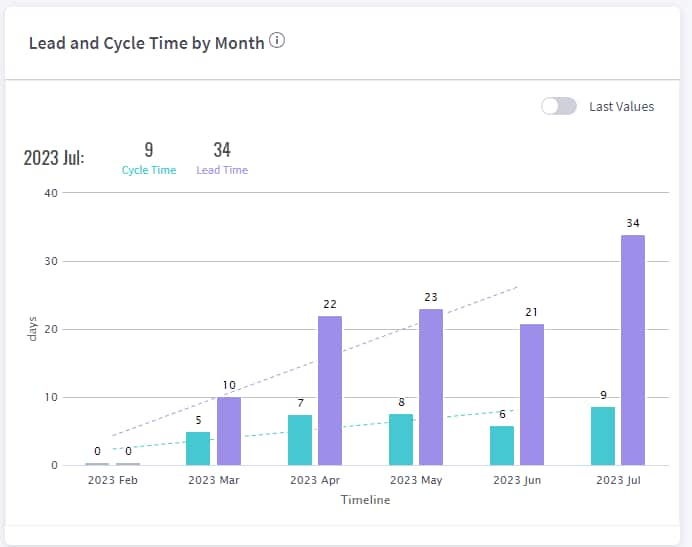
Story Cycle Time Time it takes from when the works started on a story for it to be completed

Issue Type = Story

For a single issue:

Cycle time = T done - T progress, where

  • T done - moment in time the ticket is put into a status category = DONE.

  • T progress - moment in time the ticket is put in a status belonging to In progress status category.

For all issues:

Average Cycle Time = Σ Cycle Time/N, where

  • Cycle Time - time for a single issue at the date;

  • N - number of issues transferred to Done status category.

GREEN < 5 days

 5 days >=AMBER 


RED > 10days 

Jira MVP  
Story Lead Time Time it takes from when the story was created until it is completed

Issue Type = Story

For a single issue:

Lead time = T done - T created, where

  • T done - moment in time the ticket is put into a Done status category. 

  • T created - moment in time when the ticket is created.

For all issues:

Average Lead Time = Σ Lead Time / N, where

  • Lead Time - time for a single issue at the date;

  • N - number of issues transferred to Done status category.

GREEN < 15 days

 15 days >=AMBER 


RED > 30days 

--------- JIRA MVP  
Quality of Backlog ------ ------ ----- ----- -- --